GeoPIXE for the CHESS Maia detector
GeoPIXE FAQ page Main CHESS Maia web homeGeneral GeoPIXE tips and tricks
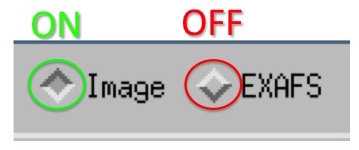
- Dark gray buttons are ON; Light gray buttons are OFF
 GeoPIXE windows
 - The main GeoPIXE window is where you will look at your final XRF map images (.dai files).
- The Sort EVT window allows you to convert raw data (data.0, data.1, etc.) into images (.dai files), with the help of many accessory files (more detail on those in the tutorial videos)
- The Spectrum Display window allows you to examine the actual XRF spectra collected at each detector pixel. You will use it a lot when calibrating and fitting the spectra
- These windows are all linked, meaning that what you do in one window can affect what is displayed in the others. For example, data processing in the Sort EVT window causes an image to be displayed in the main GeoPIXE window. As another example, if you ask GeoPIXE to look at the spectra from a certain image region, these will be shown in the Spectrum Display window. All this to say, dont be surprised if you see updates to windows other than the one you think youre working in.
Introductory tutorials
These tutorials consist of 2-4 minute screen capture videos plus related notes. Red links are placeholders for tutorial pages that don't exist yet.Getting started
INTRO: X2Go: Installing X2Go on your computer INTRO: X2Go: Starting up an XFCE session INTRO: GeoPIXE: Launching GeoPIXE from an XFCE session INTRO: GeoPIXE: Workflow Overview INTRO: GeoPIXE: File Selection: General INTRO: GeoPIXE: File Selection: Maia dataBasic GeoPIXE operations
INTRO: GeoPIXE: Loading an existing image (.dai) and navigating the image display window INTRO: GeoPIXE: Options for saving images and image data (.png, .eps, .tiff, etc.) INTRO: GeoPIXE: Analyzing image regions (.region, .spec) INTRO: GeoPIXE: Loading an existing spectrum (.spec) and navigating the spectrum display window INTRO: GeoPIXE: Importing spectra (.spec) from raw blog files (.0, .1, .2, etc.) INTRO: GeoPIXE: Apply an energy calibration to newly imported spectra (.spec) INTRO: GeoPIXE: Using the x-ray spectrum fit window (.pcm, .cuts, .yield, .damx) INTRO: GeoPIXE: Setting up a yields file (.lcm, .yield) INTRO: GeoPIXE: Generating elemental maps from raw data using the Sort EVT window (generating .dai files)More GeoPIXE operations
How to: GeoPIXE: Set up and/or modify a .throttle file in GeoPIXE How to: GeoPIXE: Generate energy calibrations from foil data How to: GeoPIXE: Calculate flux/charge calibration (Q/IC) How to: GeoPIXE: Set up and/or modify a .cuts file in GeoPIXE How to: GeoPIXE: Generate elemental maps of a sub-region in a large scan How to: GeoPIXE: Estimate areal density from x-ray transmission map using MatlabGeoPIXE and XANES
How to: GeoPIXE: Generate a list of energies for XANES spectra or XANES mapping (.csv) How to: GeoPIXE: Generate a DA matrix for XANES spectra or XANES mapping (XANES .damx) How to: GeoPIXE: Process a XANES fluorescence spectrum- point measurement (.xanes.csv) How to: PyMCA: Process a XANES transmission spectrum- point measurement (PyMCA, not GeoPIXE) How to: GeoPIXE: Batch process XANES fluorescence maps- scanning measurement (XANES .dai files) How to: GeoPIXE: Load processed XANES fluorescence maps into GeoPIXEWorked examples
This section will contain 10-15 minute screen capture videos illustrating common data processing workflows in GeoPIXE -- LouisaSmieska - 26 Sep 2016

| I | Attachment |
Action | Size | Date | Who | Comment |
|---|---|---|---|---|---|---|
| |
GeoPIXE_buttons_labels.jpg | manage | 15 K | 11 Mar 2016 - 09:39 | LouisaSmieska |
Ideas, requests, problems regarding CLASSE Wiki? Send feedback