You are here: CLASSE Wiki>CESR Web>CBPMTestProc (20 Jun 2019, PaulOsetek)Edit Attach
CBPM Module Testing
Performing Base Test- Open a new terminal window and type:
cd /nfs/acc/instr/projects/bpm_test/bpm_test_tools/matlab_tools
matlab & - Plug in module
- Timing tap (RJ45)
- Ethernet communication (RJ45)
- XBUS communication
- Front End terminations
- Power supply
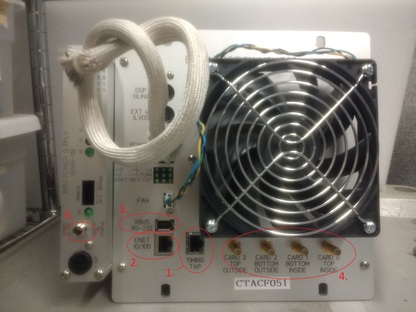 To avoid physical contact with running fan, plug in the power supply last.
 - In Matlab, type
bpm_test - Verify all connections and press Enter.
- Enter the host name, which is printed on a label on the front of the module.
- Press Enter until the tests start.
- If the RMS noise test has an issue, take note of which Frontend(s) it is, then enter “1” to continue testing.
- After test is complete, check results and unplug module.
- Open Matlab and plug in the module by following the first two steps in the above procedure (Performing Base test).
- Plug in module as described in the above procedures for performing the Base test, except connect the front ends to the pulse generator.
- In Matlab, type
bpm_pulse_test - Enter the host name, which is printed on a label on the front of the module.
- Verify that all connections are made, and press Enter to continue the test.
- Matlab should state that the test is at 125 MHz. There will be six values that it asks for, one at a time. Enter each value and press Enter:
- Common turnsmaker delay: 0
- Block A turnsmaker delay: 2
- Block B turnsmaker delay: 2
- Channel 0 delay: 400
- Channel 1 delay: 400
- Bunch to plot: 295
- The test will begin and will be performed in three stages. After each stage, four plots will be generated and will be presented on top of each other. Drag each graph to the side so that you can inspect each one. Each graph will have two sets of data plotted. They should look roughly similar, resemble a cosine curve shape, and be continuous. A problematic graph will have a plot that is completely different. It may be a straight line, seemingly random data, or some other abnormality. Attached is an image of an acceptable graph:
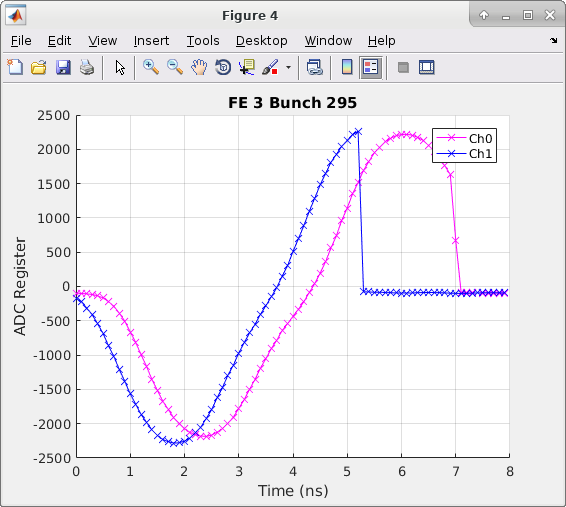
- If the graphs are satisfactory, press 1 to continue to the next test. If one or more graphs look abnormal, take notes on the issue, and Press 2 in Matlab to stop tests.
- Once the three pulse tests are complete, Matlab will inform you. You may now unplug the modulator.
- Before starting the test, a text file needs to be opened in Text Editor. The purpose is to change the module host name to match the module being tested. The host name is printed on a label on the front of the module. This text file can be found here: /nfs/acc/instr/projects/bpm_test/cbic/config/BPM_INST_params.cfg
- Use Ctrl-F to “find” the section titled “BPM_TEST1”.
- Edit the host name in that section to match the host name of the module that you’re testing.
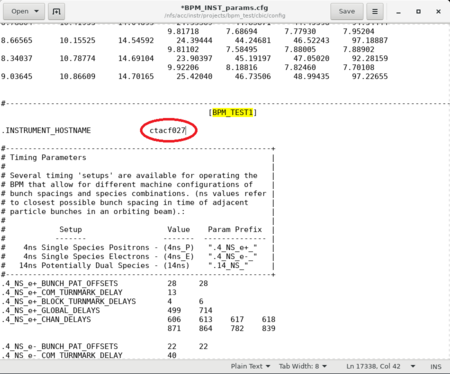
- Click on “Save” to save the file. You do not need to close the file to continue the test.
- Open a new terminal window. Enter:
ssh -X cesr202
cd /nfs/acc/instr/projects/bpm_test/cbic/ops
cbic -a Literal:BPM_TEST1 - The CBIC test will begin.
- You may see a communication attempt will fail. It will state that there will be a soft-reset and to wait 20 seconds. This is normal, so wait until the reset is complete.
- You will know if this communication attempt is successful if is states, “Commanding 1 BPM of 1 online.”
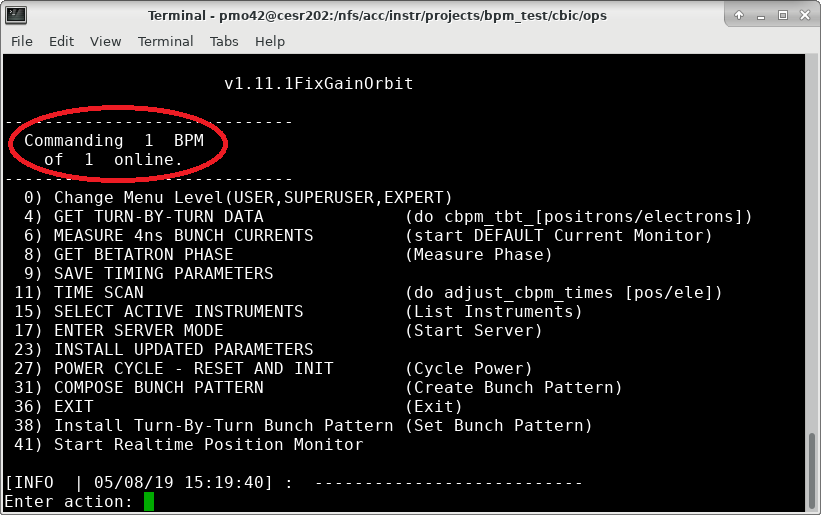
- If it states “Commanding 0 BPM of 1 online”, then there is a connection problem.
- First, look at the ethernet connection on the module. If there is an ethernet issue, the lights next to the ethernet cable will be out.
- If ethernet is working, try to force a connection.
- Enter action ‘0’ to change Menu level. Enter ‘e’ for expert level.
- Enter ‘25’ for Program Flash. Wait 30 seconds.
- Enter ‘36’ to exit.
- Power cycle the module by disconnecting the power supply, wait 10 seconds, and plug back in. Re-attempt the test.
- Enter “11” to start a Time Scan.
- Hit Enter for positrons.
- Hit Enter for bunch 1.
- Type N for NO for delay corrections.
- Plots will load. Look for continuous data of changing values. It should look something like this:
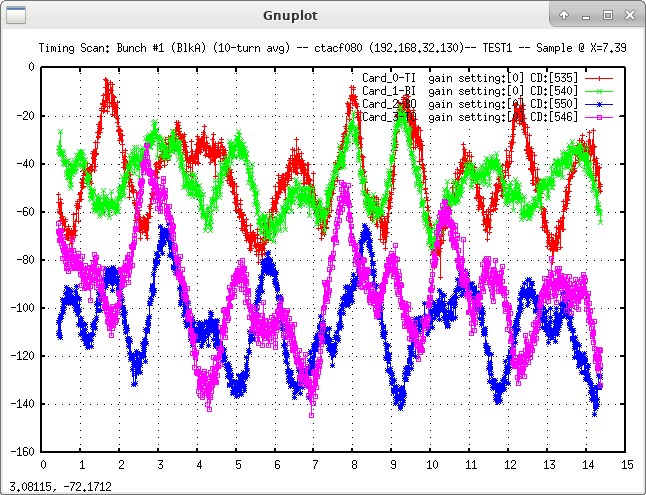
- If it does, then the test was successful.
- This graph will generate two windows: the graph itself and a smaller gnu window. Make sure to close both of them.
- Enter 36 to exit the test.
Edit | Attach | Print version | History: r1 | Backlinks | View wiki text | Edit wiki text | More topic actions
Topic revision: r1 - 20 Jun 2019, PaulOsetek
- Webs
-
 ACC
ACC
-
 ACL
ACL
-
 Bunch
Bunch
-
 CBB
CBB
-
 NSF
NSF
-
 CBETA
CBETA
-
 CESR
CESR
-
 Private
-
 CHESS
CHESS
-
 FMB
FMB
-
 Maia
Maia
-
 XIMG
XIMG
-
 XLEAP
XLEAP
-
 CHEXS
CHEXS
-
 CLASSE
-
 Inventory
-
 CLEO
CLEO
-
 CMSPhase2MREFC
-
 Computing
-
 Blogs
Blogs
-
 Newsletter
-
 Cosmology
-
 DarkPhoton
-
 ERL
ERL
-
 EngineeringDesignDrafting
-
 G2
G2
-
 HEP
HEP
-
 DBSWorkshop
-
 SWIG
SWIG
-
 HLLHCCMSMREFC
-
 HMF
HMF
-
 HumanResources
-
 Private
-
 ILC
ILC
-
 Americas
-
 CesrTA
-
 Proposal
-
 DampingRings
-
 AreaLeaders
-
 CTA09
CTA09
-
 ILCDR06
-
 ILCDR07_KEK
-
 ILCDR08
-
 S3TaskForce
-
 WWS
WWS
-
 MacCHESS
-
 Main
Main
-
 People
-
 PhotocathodeBrightBeams
-
 REU
REU
-
 SRF
SRF
-
 Safety
-
 Sandbox
-
 TestWeb
-
 System
-
 Theory
-
 Communications
-
 Documents
-
 Phase2MREFC
-
 WebDev
-
 XLEAP
XLEAP
 Copyright © by the contributing authors. All material on this collaboration platform is the property of the contributing authors.
 Ideas, requests, problems regarding CLASSE Wiki? Send feedback
