 |
|
Instant Plot: FMB SAXS/WAXS data viewing and reduction
Adding path to .bashrc
You only need to do this once- you're setting up a shortcut for yourself.- On NoMachine, connect to lnx201 and open a terminal window.
- Make sure you're in your home directory.: Running
pwdshould return/home/your_classe_id.- if you're somewhere else, running
cd ~should return you to your home area.
- if you're somewhere else, running
- Enter
code .bashrc(or open.bashrcin your favorite text editor).- This should open a text editor window withe the line "# .bashrc" at the top.
- Below the section
# Source global definitions
if [ -f /etc/bashrc ]; then
. /etc/bashrc
fi
Add the lines:### InstantPlot ###
alias activate_instantplot="source /nfs/chess/opt/miniconda3_msnc/bin/activate; conda activate saxswaxs-viewer"
export PATH="/nfs/chess/user/chess_id3b/git_repos/saxswaxs-viewer:$PATH"
- IMPORTANT: save the file!
- Close the text editor.
Setting up terminal for viewing data or for batch processing
- On NoMachine, connect to lnx201 and open a terminal window.
- Move to another node on Compute Farm
- For viewing data only, no batch processing, running
qrsh -q interactive.qshould be good enough. - If you will want to batch process, run
qrsh -q interactive.q -pe sge_pe 32to access a node with parallel cores.
- For viewing data only, no batch processing, running
- To make file finding easier, change directories to your analysis area by running
cd /nfs/chess/auxiliary/reduced_data/cycles/[YYYY-X]/id3b/[BTR-ID]/- YYYY-X is the year and cycle number, e.g. 2025-1
-
BTR-IDis PI name and project number, e.g. smieska-3222-A
- Run
activate_instantplot(or whichever name you chose when you set up your shortcut) to activate the Python environment you set up in the .bashrc- Alternatively, run
source /nfs/chess/opt/miniconda3_msnc/bin/activate; conda activate saxswaxs-viewer
- Alternatively, run
- The terminal window should now show the text
(saxs-waxs-viewer)to the left of the cursor prompt, indicating that the correct python environment is now active.
InstantPlot: Required and optional inputs
- Required: PONI files created with the pyFAI calibration tool are necessary for viewing detector data in reciprocal space
- Optional but recommended: Mask files from pyFAI calibration tool (save as .tif)
- Optional: Background detector images are optional for viewing data in InstantPlot
InstantPlot viewing data
Option 1: Open InstantPlot without specifying config file
From your prepared terminal window (i.e., on a different node from lnx201 and with the saxs-waxs-viewer python environment active), runInstantPlot.
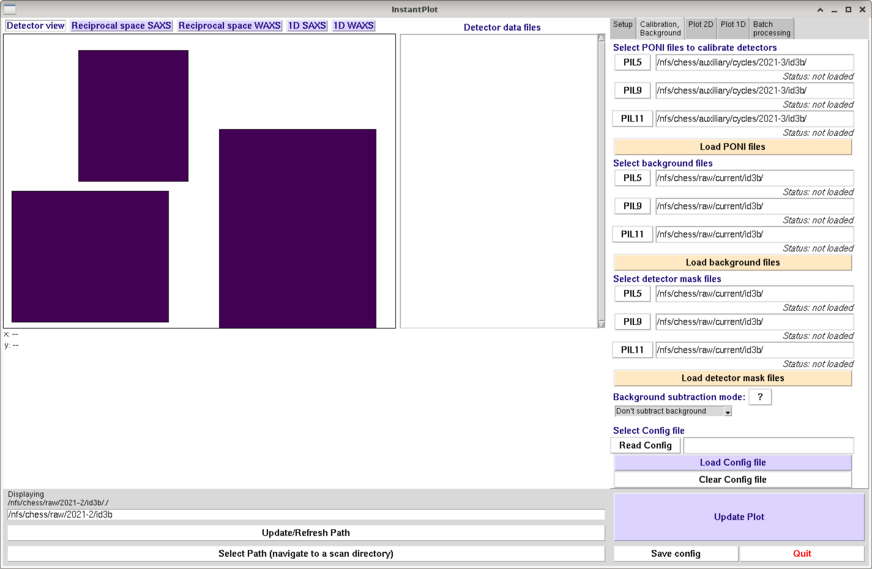
The InstantPlot gui should open. The default should be that the "Calibration, Background" tab on the upper right is selected, as seen below.
Option 1A: Manual setup (or first time setup)
-
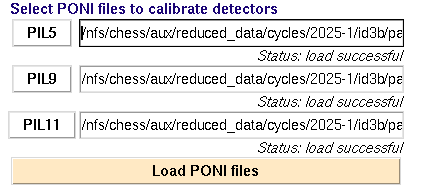
REQUIRED: Under the "Calibration, Background" tab on the upper right, select the .poni files for each detector: Click the buttons labeled PIL5, PIL9, PIL11 to locate poni files for each detector. These are usually saved in the "setup" folder for your beamtime. Highlight the needed .poni file and "open," or double click the needed file. When all paths are updated, click "Load PONI files". The message below each field should say "Status" load successful".
-
OPTIONAL: Load background tiff snapshots (locate background snapshot .tiffs for each detector). Click one of the buttons labeled PIL5, PIL9, PIL11 and navigate to a file you want to use for a background image for that detector. An option to auto-populate the remaining detector images from the same scan should pop up, usually it's convenient to say yes. Click "load background files." NOTE: when batch processing data, the background images must come from a scan that is not in the list to be processed.
-
OPTIONAL BUT RECOMMENDED: Using the pyfai calibration tool, save mask files (.tiff or .tif) for each of the three detectors. Click the buttons labeled PIL5, PIL9, PIL11 to locate each of the mask files. Click "Load detector mask files". The message below each field should say "Status" load successful".
 Proceed to viewing 2D and 1D data.
Use the “Save config” button at the bottom right to save the selected poni, background, and mask files in a text file in your setup area when finished, to make viewing data faster the next time you open InstantPlot (use option 1B or 2). It is recommended that you save the config file as .txt file in the same directory as the .poni files.
Proceed to viewing 2D and 1D data.
Use the “Save config” button at the bottom right to save the selected poni, background, and mask files in a text file in your setup area when finished, to make viewing data faster the next time you open InstantPlot (use option 1B or 2). It is recommended that you save the config file as .txt file in the same directory as the .poni files.
Option 1B: Load an existing config file from inside InstantPlot
-
Press “Clear Config file”
-
Press “Read Config” and navigate to your config file (e.g., /nfs/chess/aux/reduced_data/cycles/[YYYY-X]/id3b/[BTR-ID]/setup)
-
Press “Load Config file”
-
IMPORTANT: Press “Load PONI files”. The status message below each field does not clear from the previous configuration. You must load poni files again after reading in a new config file.
-
IMPORTANT: Press “Load background files” if desired. The status message below each field does not clear from the previous configuration. You must load background files again after reading in a new config file (if desired).
- IMPORTANT: Press "Load detector mask files" if desired. The status message below each field does not clear from the previous configuration. You must load mask files again after reading in a new config file (if desired).
Option 2: Open InstantPlot with an existing config file specified
If you have a config file saved already, you can call it and load it when you open InstantPlot by runningInstandPlot config_filename.txt. - You can either first change directories to your "setup" area, where your config files are stored, or specify the full file path to config_filename.txt.
- IMPORTANT: PONI, background (if desried) and mask files (if desired) must be loaded.
To view 2D data:
- Press “Select Path (navigate to a scan directory)” at bottom left and navigate to scan directory on /nfs/chess/raw/[YYYY-X]/id3b/[BTR-ID]/
- YYYY-X = Year-cycle number, e.g. 2025-1
- You need to open the actual scan folder (e.g. scanname_001/ ) by double clicking on it. It will look empty. Click "OK." This should populate the “tiff files” window for you to view the individual snapshots
- If you click somewhere outside the "Choose directory" popup window, it can get lost and InstantPlot can appear frozen- check the bar at the top of the window to locate the popup window again.
- “Plot2D” tab on the right has options for changing the data display here.
To view 1D data:
- Choose 1D SAXS or 1D WAXS tabs at top left. “Plot 1D” tab at top right has options for viewing these plots.
- Good to know: if you change the q/chi ranges in the Plot 1D area, you can see the result (what will be integrated) on the reciprocal space SAXS/WAXS tabs at top left.
Batch integration
As of 2023-3, we recommend using the SAXSWAXSWorkFlow methods outlined here: https://wiki.classe.cornell.edu/CHESS/FMB/SAXSWAXSWorkFlowQuitting InstantPlot
Click Quit buttom at the bottom-right corner. Clicking the "x" button at the top-right corner will cause an error (a known bug).Pre-2023-3 batch processing workflows
No longer recommended: Using InstantPlot to configure a custom batch (run with parallel_processing.py script)
Batch processing tools are available on the "batch processing" tab. Open InstantPlot as normal, described above (> InstantPlot configfilename.txt) Load your config file and make any desired adjustments in the Plot 1D views (q ranges, number of points, etc). When you're happy with the integration, go to the Batch Processing tab and choose your options:- check the boxes for integrating saxs, waxs, or both
- choose your plot type (I vs. q, I vs. chi, I vs. q vs. chi)
- choose your correction type (flux, absorption options)
- We do not redommend using the "flux- absorption- and background-corrected data" option; we find better results subtracting the background manually after integrating the data
- choose to overwrite or skip existing output files
- check the box for "Traverse child directories" if you want to process multiple folders with this configuration
- check the box for "process in parallel" if you're running on a specialized computing node and you have mapping data
- click "Generate output path" and then edit if desired
- qrsh -q interactive.q -pe sge_pe 40
- OR: qrsh -q interactive.q -pe sge_pe 32 (fewer cores but more of these nodes are available)
- Note: if you're on the station analysis computer lnx-id3b-1, you'll need to first ssh to lnx201 as yourself
- > ssh -Y your_CLASSE_ID@lnx201.classe.cornell.edu
- activate_instantplot
- cd to your setup area (/nfs/chess/auxiliary/reduced_data/cycles/YYYY-N/id3b/userid-BTR-ID/setup)
- python parallel_processing.py mybatch.yaml
No longer recommended: Using InstantPlot to run batch processing directly
Batch processing tools are available on the "batch processing" tab. If you're running on the cluster, we recommend starting InstantPlot from a specialized node:- In a new terminal window, hop to a higher computing power node with parallel processing environment invoked:
- qrsh -q interactive.q -pe sge_pe 40
- OR: qrsh -q interactive.q -pe sge_pe 32 (fewer cores but more of these nodes are available)
- Note: if you're on the station analysis computer lnx-id3b-1, you'll need to first ssh to lnx201 as yourself
- > ssh -Y your_CLASSE_ID@lnx201.classe.cornell.edu
- qrsh -q interactive.q -pe sge_pe 40
- check the boxes for integrating saxs, waxs, or both
- choose your plot type (I vs. q, I vs. chi, I vs. q vs. chi)
- choose your correction type (flux, absorption, background correction options)
- We do not redommend using the "flux- absorption- and background-corrected data" option; we find better results subtracting the background manually after integrating the data
- choose to overwrite or skip existing output files
- check the box for "Traverse child directories" if you want to process multiple folders with this configuration
- check the box for "process in parallel" if you're running on a specialized computing node and you have mapping data
- click "Generate output path" and then edit if desired
- If you chose "Traverse child directories," you should now see a pop-up window asking you to select directories. Choose the ones you want to process with the current configuration and press "continue"
- There may be a delay before you see output in the terminal window where InstantPlot is running, but give it a minute or two and you should start seeing results being written to text files


- Toolbox
-
 Create New Topic
-
 Index
Index
-
 Search
-
 Changes
-
 Notifications
-
 RSS Feed
-
 Statistics
-
 Preferences
- Webs
-
 ACC
ACC
- ACL
- Bunch
- CBB
- NSF
- CBETA
- CESR
- Private
- CHESS
- FMB
- Maia
- XIMG
- XLEAP
- CHEXS
- CLASSE
- Inventory
- CLEO
- CMSPhase2MREFC
- Computing
- Blogs
- Newsletter
- Cosmology
- DarkPhoton
- ERL
- EngineeringDesignDrafting
- G2
- HEP
- DBSWorkshop
- SWIG
- HLLHCCMSMREFC
- HMF
- HumanResources
- Private
- ILC
- Americas
- CesrTA
- Proposal
- DampingRings
- AreaLeaders
- CTA09
- ILCDR06
- ILCDR07_KEK
- ILCDR08
- S3TaskForce
- WWS
- MacCHESS
- Main
- People
- PhotocathodeBrightBeams
- REU
- SRF
- Safety
- Sandbox
- TestWeb
- System
- Theory
- Communications
- Documents
- Phase2MREFC
- WebDev
- XLEAP
 Copyright © by the contributing authors. All material on this collaboration platform is the property of the contributing authors.
 Ideas, requests, problems regarding CLASSE Wiki? Send feedback